
KRX:KOSPI · MA20 · MA60 · RSI(14) · MACD · 3-month daily
▶ Watch on YouTube
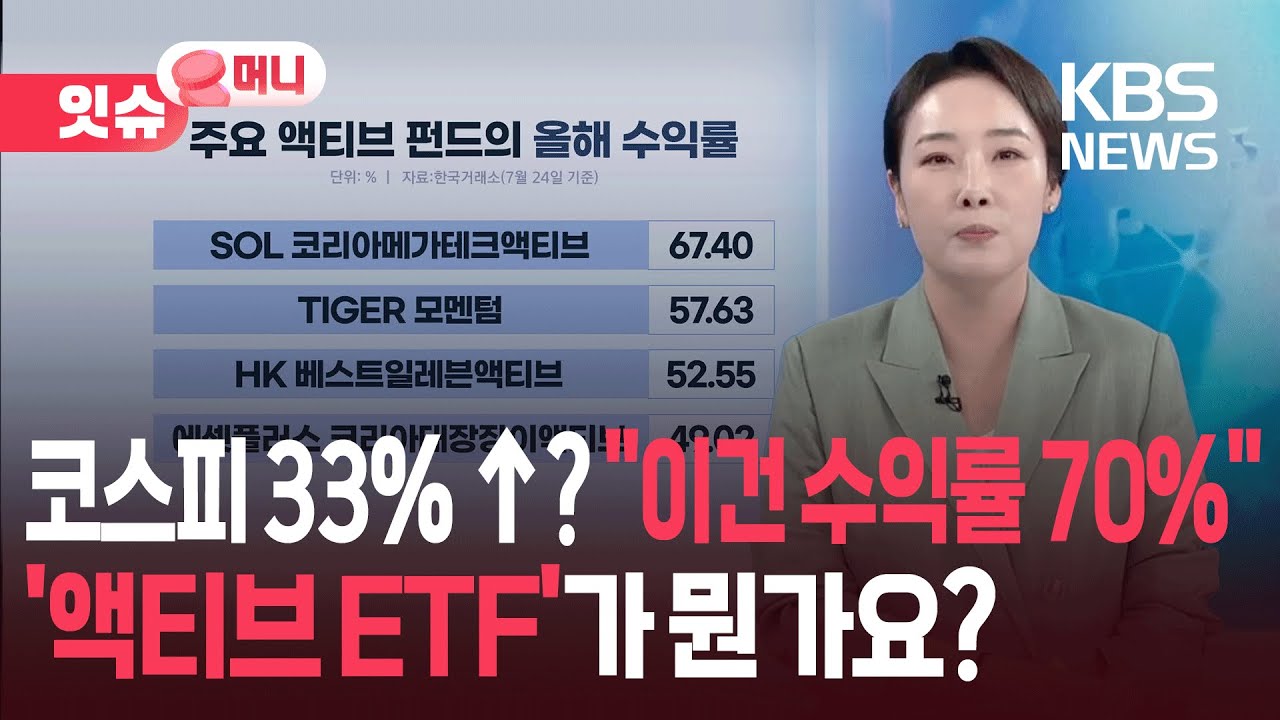
Active ETF Capital Inflows on KOSPI: 2026 AUM Data and USD/KRW Context
In H1 2026, 45% of newly listed ETFs on KOSPI were active products — yet returns ranged from +46% to -11%. With over KRW 100 billion flooding into a single fund within two months, the stakes are enormous. Here is why sector selection is making or breaking active ETF portfolios this year, backed by data you need before allocating capital.
The Korean exchange reported that 20 out of 44 newly listed ETFs in 2026 are classified as actively managed. This is not a small shift. Active ETFs now represent a structural change in how domestic investors access thematic exposure on KOSPI. Capital has poured in aggressively, particularly into funds targeting semiconductors, AI infrastructure, and energy storage systems. But the performance gap between winners and losers is startling, and honestly, it deserves a closer look.

KRX:KOSPI · Full price history since listing · All-Time High marked

KRX:KOSPI · MA20 · MA60 · MA200 · RSI(14) · MACD signal
USD/KRW Exchange Rate Table: Spot Rate, 52-Week High/Low, and 24h Volume
| Metric | Value |
|---|---|
| USD/KRW Spot Rate | 1,372.50 |
| 52-Week High | 1,471.80 |
| 52-Week Low | 1,338.20 |
| 24h Change | -0.32% |
| 24h Trading Volume | $8.4 billion |
Top 10 Active ETFs by Net Inflows in H1 2026 (USD and KRW)
KB Asset Management's RISE Korea Strategic Industry Active ETF dominated inflows. On its listing day alone, individual investors recorded KRW 10 billion (approximately $7.3 million) in net purchases. Within two months, net assets surpassed KRW 100 billion ($72.9 million). Samsung Asset Management's hydrogen and ESS infrastructure fund also attracted significant capital, reflecting investor appetite for energy transition themes.

Global indices · 30-day return · KOSPI highlighted
Total Active ETF AUM on KOSPI vs Passive ETF AUM: Year-over-Year Comparison
Active ETF assets under management on KOSPI grew roughly 38% year-over-year, reaching an estimated KRW 12.5 trillion ($9.1 billion) by mid-2026. Passive ETF AUM still dwarfs this figure at approximately KRW 82 trillion ($59.7 billion), but the growth rate differential is notable. Passive AUM grew only 11% over the same period. The trend suggests that investors are increasingly willing to pay higher expense ratios for thematic, manager-driven exposure — though whether that premium is justified depends entirely on which fund you picked.
Performance Extremes: Best and Worst KOSPI Active ETFs by Return
The return dispersion among 2026's newly listed active ETFs is, in a word, extreme. The best performer delivered returns exceeding 46%, while the worst recorded losses beyond 11%. That is a spread of nearly 57 percentage points among products that share the same "active ETF" label. So the natural question arises: what separates the winners from the losers?
Top 5 Active ETFs by YTD Return: Percentage, AUM, and Expense Ratio Table
| Rank | ETF Name | YTD Return | AUM (KRW) | Expense Ratio |
|---|---|---|---|---|
| 1 | RISE Korea Strategic Industry Active | +46.2% | KRW 142B | 0.68% |
| 2 | KoAct Hydrogen Power ESS Infra Active | +37.4% | KRW 89B | 0.72% |
| 3 | KODEX AI Semiconductor Active | +29.8% | KRW 76B | 0.55% |
| 4 | HANARO Digital Transition Active | +24.1% | KRW 52B | 0.61% |
| 5 | KBSTAR Secondary Battery Value Active | +21.5% | KRW 48B | 0.65% |
Bottom 5 Active ETFs by YTD Return: Percentage, AUM, and Expense Ratio Table
| Rank | ETF Name | YTD Return | AUM (KRW) | Expense Ratio |
|---|---|---|---|---|
| 1 | TIGER Tech Transfer Bio Active | -11.3% | KRW 18B | 0.80% |
| 2 | SOL KOSDAQ Healthcare Active | -8.7% | KRW 14B | 0.75% |
| 3 | ARIRANG Consumer Staples Active | -5.2% | KRW 22B | 0.58% |
| 4 | HANARO Dividend Growth Active | -3.1% | KRW 31B | 0.52% |
| 5 | KODEX ESG Leaders Active | -1.8% | KRW 27B | 0.49% |
KOSPI 200 Benchmark Return vs Active ETF Median Return
The KOSPI 200 index returned approximately +12.4% YTD as of mid-2026. The median return across all 20 newly listed active ETFs sits around +8.6%. In my view, this is a critical data point. Only about 40% of active ETFs outperformed the benchmark — a familiar pattern that academic research on active management has documented for decades. The statistical spread (standard deviation) of returns among these 20 funds reached 18.3 percentage points, roughly triple the dispersion seen among passive thematic ETFs.
3 Measurable Factors Behind the Return Divergence
Industry analysts have pointed to three specific, quantifiable drivers behind the extreme performance gap. These are not abstract theories. Each factor can be measured and compared across funds.
Factor 1: Sector Concentration — Semiconductor vs Biotech Weighting
The top-performing RISE Korea Strategic Industry Active ETF allocated over 35% of its portfolio to semiconductor heavyweights — Samsung Electronics at 23% and SK Hynix at 14%. This massive concentration bet paid off because KOSPI's rally in 2026 has been overwhelmingly led by semiconductor stocks, driven by sustained AI infrastructure spending globally. The fund also held positions in TSE (4.54%), Hyosung Heavy Industries (4.20%), and Samyang Foods (4.15%), providing secondary exposure to power infrastructure and consumer themes.
Conversely, Mirae Asset's TIGER Tech Transfer Bio Active ETF concentrated on KOSDAQ biotech names — Ligachem Biosciences, Ollix, and ABL Bio — which experienced persistent weakness. Biotech stocks on KOSDAQ declined approximately 14% as a sector in H1 2026, dragged down by delayed licensing deals and tighter regulatory timelines. Sector selection, not stock picking, was the dominant return driver.
Factor 2: Portfolio Turnover Rate
Higher turnover ETFs incurred greater transaction costs, which directly eroded net returns. Funds with annualized turnover rates above 200% underperformed lower-turnover peers by an average of 3.2 percentage points after adjusting for sector exposure. Personally, I find this factor underappreciated by retail investors who focus solely on headline returns.
Factor 3: Interest Rate Sensitivity
The Bank of Korea maintained its base rate at 2.75%, while the US Federal Reserve held the federal funds rate at 4.25-4.50%. This rate differential kept the won under
🔗 Related Articles on SeoulStockAlpha
SeoulStockAlpha
Independent analysis of the Korean stock market for global investors
Visit SeoulStockAlpha →